Daily Forex Signals & Market Insights: February 9- Intraday Focus
- forex368

- Feb 9, 2024
- 11 min read
- Market Outlook: Rangebound trading expected today.
- Key Event - Australia: RBA Governor Michelle Bullock to address House of Representatives Standing Committee on Economics in Canberra.
- European Session: Notable event includes Buba President Joachim Nagel speaking in Paris.
- Key Event - Canada: Release of Employment data, forecasted 16k jobs increase, unemployment rate potentially rising to 5.9%.
- Morning Currency Movements:
- Bloomberg Dollar Spot Index: Remained stable.
- Euro: Unchanged, trading around $1.0772.
- Japanese Yen: Steady at 149.38 per dollar.
- Offshore Yuan: Maintained level at 7.2124 per dollar.
- British Pound: Stable at $1.2618.

Forex Trade Signals
EUR/USD GBP/USD USD/JPY USD/CHF NZD/USD AUD/USD USD/CAD EUR/GBP

Asset: EURUSD
Pivot Point: 1.0770
Trade Direction: BEARISH
Trade Confidence: Moderate - The direction is bearish due to the current EURUSD price being below the pivot point. The moderate confidence stems from the rangebound activity indicated by the charts, with no strong directional momentum suggested by the indicators.
Yesterday's Trend
The EURUSD showed rangebound behavior, suggesting a lack of clear directional bias and consolidation in the market.
Market Trend Analysis
- Volatility: Relatively stable as indicated by the current Average True Range (ATR) readings.
- Moving Average (MA): With EURUSD below the Moving Average, it implies a potential bearish inclination.
- Ichimoku Cloud: Since the price is below the cloud, this could indicate a bearish trend.
- RSI: The RSI is below the midpoint but not yet in oversold territory, suggesting there may be room for downward movement.
- Bollinger Bands: The price is closer to the lower band, which may indicate bearish momentum.
- MACD: The MACD is below the signal line and negative, supporting the bearish trend direction.
- Volume: The actual volume data is not provided, so its impact cannot be included in the analysis.
🎯 Profit Targets
- Sell:
- 1st Target (1st Support): 1.0749
- 2nd Target (2nd Support): 1.0720
- 3rd Target (Third Support): 1.0699
❌ Stop Loss Guidelines
- Sell: Set the stop loss at the 1st Resistance level of 1.0799.
Suggestion
The indicators suggest initiating a sell position with the first target set at the 1st support level. A stop loss should be placed at the 1st resistance level to manage the risk.
Viewpoint Recap
The current analysis for EURUSD suggests a bearish approach for the day, with moderate confidence due to the price being below the pivot point and technical indicators supporting a downward trend. However, the overall market's rangebound state calls for a careful and measured approach to trading.
Asset: GBPUSD
Pivot Point: 1.261
Trade Direction: BEARISH
Trade Confidence: Moderate - This bearish direction is chosen due to the current GBPUSD price being below the pivot point of 1.261. The moderate confidence is due to the indicators showing a potential for a downward trend but within a rangebound market as indicated by the current technical analysis.
Yesterday's Trend
GBPUSD may have followed a sideways to slightly bearish trend, which is typically indicative of a consolidating market with no clear directional momentum.
Market Trend Analysis
- Volatility: The Average True Range (ATR) shows moderate volatility, which could support a potential for price movement either way within a defined range.
- Moving Average (MA): GBPUSD is around the moving average, indicating a neutral market sentiment without strong bullish or bearish signals.
- Ichimoku Cloud: The price below the Ichimoku Cloud may suggest a bearish sentiment.
- RSI: The RSI is near the midpoint, not suggesting an overbought or oversold condition, aligning with a moderate bearish outlook.
- Bollinger Bands: The price is not touching either band strongly, supporting the moderate volatility and rangebound condition.
- MACD: The MACD line below the signal line and around the zero axis indicates bearish momentum, but not strongly so.
- Volume: Specific volume information is not available, which can often provide insight into the strength of a trend.
🎯 Profit Targets
- Sell:
- 1st Target (1st Support): 1.258
- 2nd Target (2nd Support): 1.254
- 3rd Target (Third Support): 1.251
❌ Stop Loss Guidelines
- Sell: Set the stop loss at the 1st Resistance level of 1.265.
Suggestion
Given the indicators and current price position in relation to the pivot point, initiating a sell position could be considered with the first target set at the 1st support level. A stop loss should be placed at the 1st resistance level to manage risk.
Viewpoint Recap
The analysis for GBPUSD today points towards a bearish position with moderate confidence, highlighting the importance of monitoring the price action around the pivot point and key technical indicators. Traders should remain cautious and watch for any breaking news or economic data that might affect market sentiment and cause a breakout from the current range.
Asset: USDJPY
Pivot Point: 148.92
Trade Direction: BULLISH
Trade Confidence: High - This bullish direction is due to the current price of USDJPY being above the pivot point. The high confidence is further supported by the MACD showing a bullish crossover, the RSI trending upwards towards the overbought region, and the price trending above the Ichimoku Cloud.
Yesterday's Trend
The USDJPY was on an uptrend, as suggested by the positioning above key technical indicators and the upward momentum visible on the chart.
Market Trend Analysis
- Volatility: The ATR indicates increasing volatility, which in the context of an uptrend, may suggest strong buying pressure.
- Moving Average (MA): With USDJPY trading above the Moving Average, this signals bullish momentum.
- Ichimoku Cloud: The price is above the Ichimoku Cloud, which generally indicates a bullish trend.
- RSI: The RSI is moving towards the overbought territory, which can sometimes precede a continuation of the bullish trend.
- Bollinger Bands: The price is near the upper Bollinger Band, which often indicates strength in an uptrend, though care should be taken as it may also signal an impending pullback if it becomes overextended.
- MACD: The MACD line is above the signal line and positive, confirming the bullish trend.
- Volume: The volume trend is not provided, but increasing volume with price increases typically confirms a strong uptrend.
🎯 Profit Targets
- Buy:
- 1st Target (1st Resistance): 149.90
- 2nd Target (2nd Resistance): 150.4867
- 3rd Target (3rd Resistance): 151.47
❌ Stop Loss Guidelines
- Buy: Set the stop loss at the 1st Support level of 148.3333.
Suggestion
With the bullish indicators present, it's suggested to enter a buy position, aiming for the first resistance as the initial target, with a stop loss just below the first support to protect the trade against any sudden reversals.
Viewpoint Recap
Today's analysis of USDJPY presents a bullish scenario with high trade confidence, backed by technical indicators showing strong upward momentum. Traders should continue to monitor the pair for any changes in market conditions that could affect the trend.
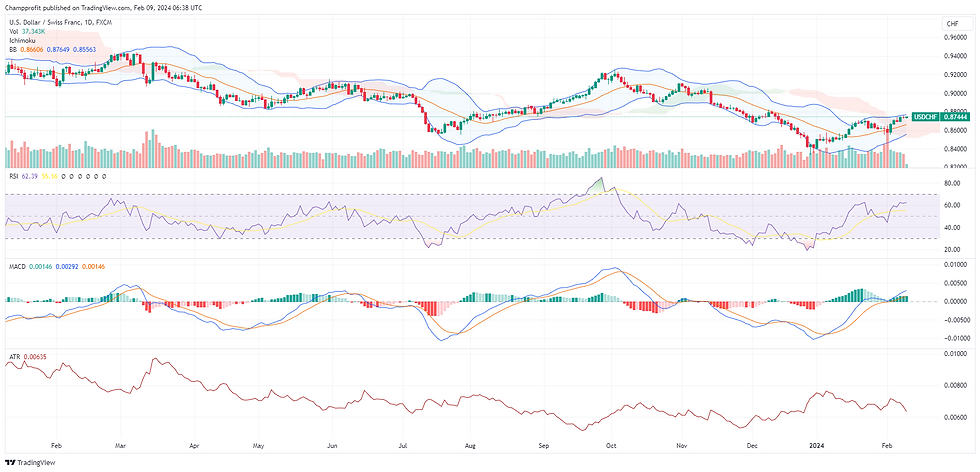
Asset: USDCHF
Pivot Point: 0.874
Trade Direction: BULLISH
Trade Confidence: High - The trade direction is bullish based on the current price being above the pivot point and the technical indicators suggesting upward momentum.
Yesterday's Trend
The USDCHF was trending upwards, indicated by the price movement above key technical levels.
Market Trend Analysis
- Volatility: The Average True Range (ATR) is showing moderate volatility, suggesting some level of price movement but not overly volatile.
- Moving Average (MA): The currency pair is above the Moving Average, implying bullish sentiment.
- Ichimoku Cloud: The price is above the Ichimoku Cloud, which typically indicates a bullish trend.
- RSI: The RSI is above 50 but not yet in the overbought territory, indicating some bullish momentum without being extreme.
- Bollinger Bands: The price is near the upper Bollinger Band, often a sign of strength in an uptrend, but caution is advised as it could indicate an overbought condition.
- MACD: The MACD is above the signal line and positive, which supports the bullish market trend.
- Volume: Specific volume data is not provided, so the impact of volume on the trend cannot be assessed.
🎯 Profit Targets
- Buy:
- 1st Target (1st Resistance): 0.876
- 2nd Target (2nd Resistance): 0.878
- 3rd Target (3rd Resistance): 0.880
❌ Stop Loss Guidelines
- Buy: Set the stop loss at the 1st Support level of 0.872.
Suggestion
The bullish indicators suggest entering a buy position, with a progression towards the first resistance level as the initial profit target. The stop loss is set below the first support to minimize potential downside risk.
Viewpoint Recap
The USDCHF analysis shows a bullish outlook for today, backed by several technical indicators that point towards an upward trend. As always, traders should remain vigilant and responsive to any sudden shifts in market sentiment or economic announcements.
Disclaimer: Trading in forex carries a high level of risk and may not be suitable for all investors.
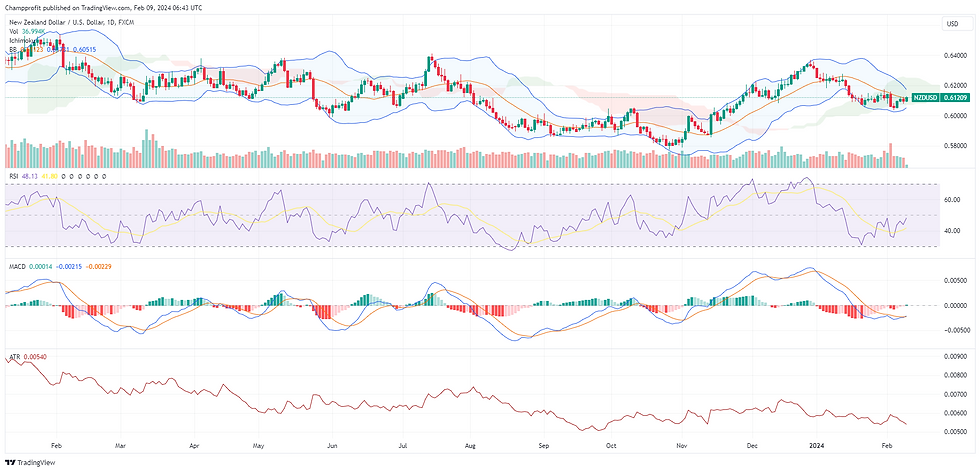
Asset: NZDUSD
Pivot Point: 0.610
Trade Direction: NEUTRAL to SLIGHTLY BULLISH
Trade Confidence: Moderate - The trade direction leans towards a neutral to slightly bullish stance due to the price being close to the pivot point. The indicators suggest some upward potential but not with high conviction.
Yesterday's Trend
The NZDUSD appears to have been trading within a tight range, indicating a lack of strong directional momentum.
Market Trend Analysis
- Volatility: The Average True Range (ATR) suggests moderate volatility, which may not drive significant price movements.
- Moving Average (MA): The currency pair is near the Moving Average, indicating a lack of clear trend.
- Ichimoku Cloud: The proximity of the price to the Ichimoku Cloud indicates uncertainty, with no clear trend established.
- RSI: The RSI is near the midpoint, which aligns with a neutral market sentiment.
- Bollinger Bands: The price operating within the bands suggests that the market is not in an overbought or oversold condition.
- MACD: The MACD is close to the baseline with the signal line, which does not indicate strong bullish or bearish momentum.
- Volume: Without specific volume data, we cannot ascertain market participation levels, which could provide additional insights.
🎯 Profit Targets
- Buy (with caution):
- 1st Target (1st Resistance): 0.612
- 2nd Target (2nd Resistance): 0.615
- 3rd Target (3rd Resistance): 0.617
❌ Stop Loss Guidelines
- Buy: Set the stop loss at the 1st Support level of 0.608.
Suggestion
Given the technical indicators' mixed signals, a cautious buy position could be considered. The targets should be set at the resistance levels, and a stop loss should be placed at the first support level to manage the risk effectively.
Viewpoint Recap
The analysis of NZDUSD suggests a neutral to slightly bullish bias for today's session, with moderate confidence due to the lack of strong indicators for a decisive move. Traders should be prepared for potential range-bound trading and watch for any economic news that might affect the currency pair.
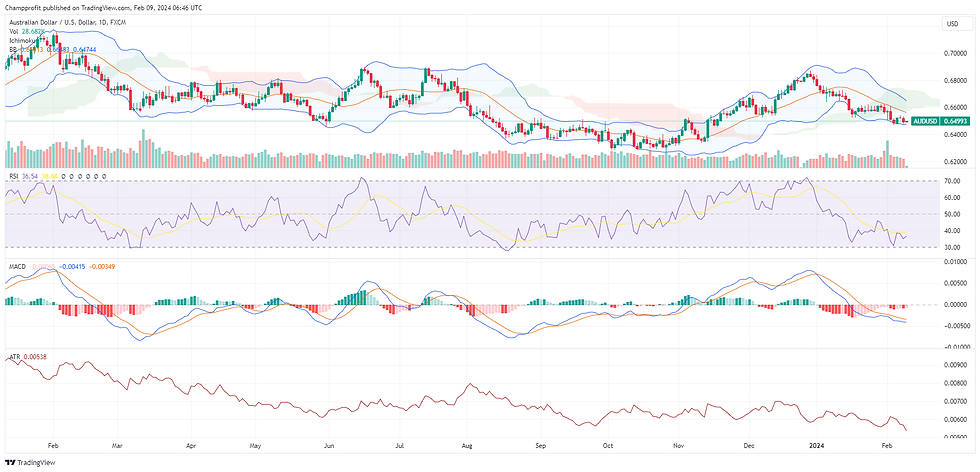
Asset: AUDUSD
Pivot Point: 0.650
Trade Direction: BULLISH
Trade Confidence: Moderate - The bullish stance is due to the price being near the pivot point, with technical indicators showing some potential for an upward movement, although the signals are not strongly pronounced.
Yesterday's Trend
The AUDUSD pair showed some fluctuation but remained near the pivot point, suggesting a balance between buyers and sellers without a clear directional trend.
Market Trend Analysis
- Volatility: The Average True Range (ATR) indicates a moderate level of volatility which might not lead to wide price swings.
- Moving Average (MA): The currency pair's position near the Moving Average implies a neutral sentiment, with potential for either direction.
- Ichimoku Cloud: The price near the Ichimoku Cloud indicates indecision in the market trend.
- RSI: The RSI is near the 50 level, which is typically considered a neutral point, neither overbought nor oversold.
- Bollinger Bands: The price is within the Bollinger Bands, suggesting that the price is relatively stable without extreme volatility.
- MACD: The MACD line is near the signal line, indicating a lack of strong momentum in either direction.
- Volume: Specific volume data is not available, which can often provide insight into the strength of a trend.
🎯 Profit Targets
- Buy:
- 1st Target (1st Resistance): 0.652
- 2nd Target (2nd Resistance): 0.655
- 3rd Target (3rd Resistance): 0.658
❌ Stop Loss Guidelines
- Buy: Set the stop loss at the 1st Support level of 0.647.
Suggestion
Entering a cautious buy position may be considered, targeting the first resistance level with a stop loss set just below the first support level to mitigate risk.
Viewpoint Recap
The analysis for the AUDUSD suggests a moderate bullish outlook for today's trading session. However, the market's indecision as indicated by the technical analysis requires a cautious approach. Traders should keep an eye on market news that could affect the currency pair and adjust their strategies accordingly.
Asset: USDCAD
Pivot Point: 1.347
Trade Direction: BULLISH
Trade Confidence: Moderate - The current price is above the pivot point, suggesting a bullish trend. However, the moderate confidence is due to the mixed signals from the technical indicators.
Yesterday's Trend
The USDCAD pair seems to have been trading in a range, with no significant breakouts, indicating a balance in the market forces.
Market Trend Analysis
- Volatility: The Average True Range (ATR) shows moderate volatility, indicating potential for movement but not excessive.
- Moving Average (MA): The pair is near the moving average, suggesting a neutral to slight bullish sentiment.
- Ichimoku Cloud: The price is above the Ichimoku Cloud, which can be considered a bullish signal.
- RSI: The RSI is around the midpoint, suggesting a lack of strong bullish or bearish momentum.
- Bollinger Bands: The price is within the bands, indicating no strong volatility or trend strength.
- MACD: The MACD line is slightly above the signal line, providing a weak bullish signal.
- Volume: Without specific volume data, we cannot determine the conviction behind any price movements.
🎯 Profit Targets
- Buy:
- 1st Target (1st Resistance): 1.349
- 2nd Target (2nd Resistance): 1.351
- 3rd Target (3rd Resistance): 1.353
❌ Stop Loss Guidelines
- Buy: Set the stop loss at the 1st Support level of 1.344.
Suggestion
Based on the indicators, a moderate bullish position could be considered with a target at the first resistance level. The stop loss should be placed just below the first support level to mitigate risk.
Viewpoint Recap
The USDCAD analysis today indicates a cautiously bullish outlook, with technical indicators suggesting some upside potential. Traders should monitor the pair for any changes that could affect this view, especially around key economic releases or market news.
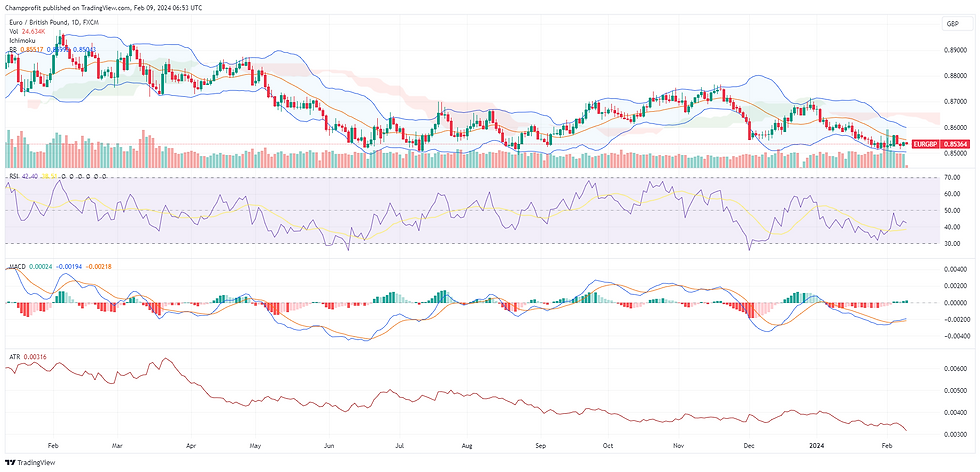
Asset: EURGBP
Pivot Point: 0.854
Trade Direction: NEUTRAL to SLIGHTLY BULLISH
Trade Confidence: Moderate - The direction is cautiously bullish based on the price being just above the pivot point. However, the technical indicators give mixed signals, hence the moderate confidence.
Yesterday's Trend
The EURGBP appeared to be in a consolidation phase, with the price fluctuating around the pivot point without a clear directional trend.
Market Trend Analysis
- Volatility: The Average True Range (ATR) indicates low to moderate volatility, suggesting limited price movement.
- Moving Average (MA): The pair's trading around the moving average suggests a lack of strong momentum in either direction.
- Ichimoku Cloud: The price near the Ichimoku Cloud signifies indecision in the market, not confirming a strong bullish or bearish trend.
- RSI: The RSI is hovering around the 50 level, which typically indicates a neutral market condition.
- Bollinger Bands: The price is within the bands, further signaling a lack of strong volatility or trend.
- MACD: The MACD is close to the signal line, indicating a lack of strong momentum, but slightly on the bullish side.
- Volume: Specific volume data is not provided, which would be helpful in confirming the strength of the trend.
🎯 Profit Targets
- Buy (with caution):
- 1st Target (1st Resistance): 0.855
- 2nd Target (2nd Resistance): 0.856
- 3rd Target (3rd Resistance): 0.857
❌ Stop Loss Guidelines
- Buy: Set the stop loss at the 1st Support level of 0.853.
Suggestion
A cautious buy position could be considered due to the price being slightly above the pivot point, aiming for the resistance levels as profit targets, with a stop loss placed at the first support level to manage risk.
Viewpoint Recap
The current analysis for EURGBP indicates a neutral to slightly bullish outlook with moderate confidence. Given the nearness to the pivot point and the mixed technical signals, traders should employ a cautious approach and stay alert to market changes that could impact the currency pair's movement.
Disclaimer: These Forex Trade Signals are based on the current charts and market conditions. Always conduct your own analysis and consider risk management strategies before entering any trade. Markets are dynamic, and conditions can change rapidly.
As with all investments, your capital is at risk. Investments can fall and rise and you may get back less than you invested.
The information provided does not constitute, in any way, a solicitation or inducement to buy or sell securities and similar products.
Forex signals, comments and analysis created and reflect the views forex368.com at any given time and are subject to change at any time. ©2024 by forex368.com.
Without Knowledge, Prepare for Failure!


