Dollar's Rise: A Tactical Analysis for Traders
- forex368

- Jul 11
- 2 min read
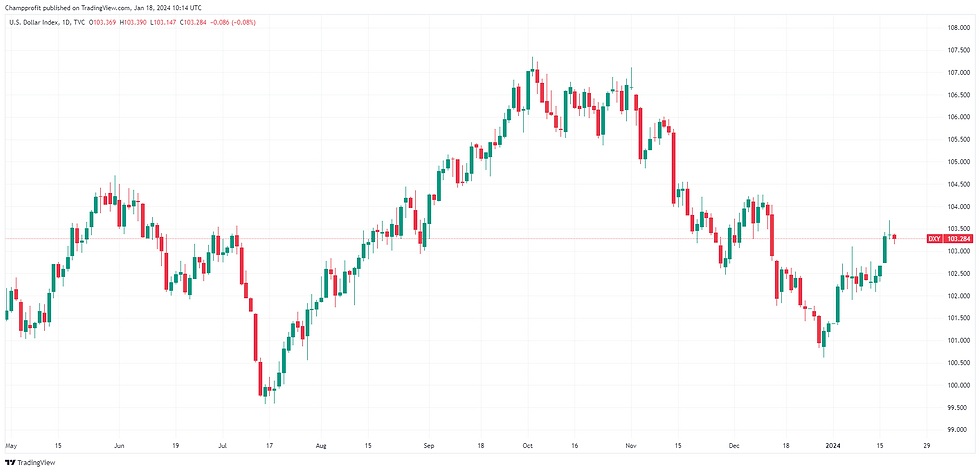
In the volatile expanse of the global financial market, the U.S. Dollar has recently staged an impressive rally, reminiscent of its strength last seen in March of the preceding year.
This resurgence has been fuelled by a cocktail of geopolitical tensions and the market's reassessment of the Federal Reserve's monetary policy trajectory.
The current market dynamics reveal a strategic landscape for traders, with the U.S. Dollar Index (DXY) at the forefront, directly influencing the trading trajectories of major forex pairs, gold, and oil.

Market Analysis:
Amidst the swirling uncertainties of geopolitical strife and economic fluctuations, the U.S. Dollar has emerged as a beacon of resilience. On January 16, 2024, the Dollar Spot Index witnessed a 0.8% upsurge, the strongest in ten months, bolstered by the dollar outpacing all of the world's major currencies.
This surge defies the previous consensus that anticipated a waning dollar in light of potential Federal Reserve rate cuts.
However, recent events, including tensions in the Red Sea affecting global trade and the persistent economic frailties in China, have reignited the dollar's allure as a safe haven.
Trading Strategies Dollar for:
For forex traders, the current landscape presents a complex tapestry of factors to navigate.
In particular, the U.S. Dollar's upward trajectory suggests a cautious but potentially lucrative approach for those wielding the right strategies.
Technical indicators are pivotal in charting the course.
Key elements such as the Moving Average, Ichimoku Cloud, Relative Strength Index (RSI), and Bollinger Bands should guide traders in discerning trend directions and pivot points.
These tools provide a numerical and visual representation of market sentiment and price movements, essential for making informed trading decisions.
The dollar's rally serves as a testament to the currency's enduring appeal during periods of uncertainty.
As traders grapple with the shifting tides of central bank policies and geopolitical developments, a strategic approach anchored in technical analysis and market indicators will be crucial.
With regulated brokers facilitating the trading landscape, leveraging these insights while managing risk will remain paramount in capitalising on forex market movements.

Intraday Forex Signals:
Pair: USD/JPY
Yesterday's Trend: The USD/JPY pair demonstrated a bullish trend, gaining strength alongside the DXY index.
Trade Direction: BULLISH
Trade Probability: 65%
Pivot Point: 146.50
Indicators:
- Volatility: Increasing, indicating potential for significant price movements.
- Moving Average (MA): The pair is trading above the 20-day MA, suggesting a continued bullish trend.
- Ichimoku: The price is above the Ichimoku cloud, which supports the bullish outlook.
- RSI: The RSI is approaching overbought territory, signaling high buying momentum.
- Bollinger Bands: The price is nearing the upper band, indicating a strong uptrend.
🎯 Targets for Taking Profits:
- Buy: Targets for a bullish position are set at the 1st Resistance level of 147.00, the 2nd Resistance level of 147.50, and the 3rd Resistance level of 148.00.
❌ Stop Loss Guidelines:
- Buy: A prudent stop loss for a long position is placed at the Support level of 145.50, just below the pivot point.
Suggestion: Given the bullish indicators and a favorable pivot point position, traders might consider a long position in USD/JPY, with recommended profit targets and stop loss parameters to manage risk effectively.


