Today's Forex Signals: Technical Analysis, November 20, 2023
- forex368

- Nov 20, 2023
- 9 min read
Global markets are experiencing a shift as the Federal Reserve's potential end to its tightening cycle spurs optimism, impacting stocks, currencies, and bonds worldwide.
Nikkei's Remarkable Surge: Japan’s Nikkei 225 Stock Average hits a 33-year high, propelled by yen weakness and robust corporate earnings.
Dollar Weakening: The dollar is declining against major peers, influenced by the Fed's dovish stance and anticipation of an end to interest rate hikes.
Fed Rate Cut Speculations: Traders estimate about a 30% chance of a Fed rate cut in March, following recent comments from Fed officials.
Currency Strategy Insights: Analysts suggest the dollar and Treasury yields will continue to face downward pressure amid a dovish Fed narrative.
Oil Market Outlook: Oil prices are on the rise, with upcoming OPEC+ meetings expected to influence market dynamics into 2024.
Upcoming Corporate Earnings: Key earnings reports from Xiaomi Corp. and Nvidia Corp. are highly anticipated by investors.
Today's Key Events: Speeches by ECB governing council members, the Bank of England Governor, and US economic indicators are on the watch list.
Follow Live Signals

Today's Forex Signals

Intraday Forex Signal for XAUUSD (Gold)
📊 Current Analysis
Pair: XAUUSD
Pivot Point: 1983.97
Volatility: Appears to be increasing as reflected by the wider Bollinger Bands.
Moving Average: Gold is currently trading above the 20 SMA, indicating a BULLISH trend.
Ichimoku Cloud: Price is above the cloud, suggesting bullish momentum.
RSI: Near 60, indicating neither overbought nor oversold conditions, but leaning towards potential bullish momentum.
Bollinger Bands: The price is near the upper band, signaling a strong uptrend but also a possibility of short-term pullback.
📈 Trade Direction: BULLISH
📊 Trade Probability: 70%
✨ Friday's Trend: The trend was clearly bullish as the price remained above the moving average.
🎯 Targets for Taking Profits:
1st Resistance Level: 1989.95
2nd Resistance Level: 1999.24
3rd Resistance Level: 2005.22
❌ Stop Loss Guidelines:
Buy Trade: Set the stop loss around the 1st Support level at 1974.68.
🛎️ Trade Suggestion:
Buy XAUUSD at current levels with a stop loss at 1974.68, aiming for the first target at 1989.95, followed by 1999.24 and 2005.22 as subsequent targets.
The trade direction is bullish based on the price being above the 20 SMA and the Ichimoku Cloud, with increasing volatility and a supportive RSI reading.

Intraday Forex Signal for WTI Crude Oil
📊 Current Analysis
Instrument: WTI Crude Oil
Pivot Point: 74.88
Volatility: The Bollinger Bands indicate a stable volatility as the bands are not widely expanded.
Moving Average: WTI is trading above the 20 SMA, indicating a BULLISH trend.
Ichimoku Cloud: The price is hovering near the Ichimoku cloud, suggesting a potential trend change.
RSI: Slightly above 50, indicating a slight bullish momentum but caution is advised as it is not strongly over 50.
📈 Trade Direction: BULLISH
📊 Trade Probability: 65%
✨ Friday's Trend: Oil showed a recovery, moving upward from below the moving average to above, signaling a change to a bullish trend.
🎯 Targets for Taking Profits:
1st Resistance Level: 77.00
2nd Resistance Level: 78.12
3rd Resistance Level: 80.24
❌ Stop Loss Guidelines:
Buy Trade: Set the stop loss around the 1st Support level at 73.76.
🛎️ Trade Suggestion:
Buy WTI at current levels with a stop loss at 73.76, targeting the first resistance at 77.00, followed by 78.12 and 80.24 as subsequent targets.
The direction is cautiously bullish due to the price being above the 20 SMA and the RSI indicating a growing bullish momentum.
However, monitor the price as it is near the Ichimoku cloud which can indicate a potential trend change.


Intraday Forex Signal for EURUSD
📊 Current Analysis
Pair: EURUSD
Pivot Point: 1.089
Volatility: The Bollinger Bands are moderately wide, suggesting moderate volatility.
Moving Average: The pair is trading above the 20 SMA, which is a BULLISH signal.
Ichimoku Cloud: The price is above the cloud, further confirming the bullish trend.
RSI: Just above 50, suggesting a slight bullish momentum but close to neutral.
📈 Trade Direction: BULLISH
📊 Trade Probability: 68%
✨ Yesterday's Trend: The trend for EURUSD was bullish, moving consistently above the moving average.
🎯 Targets for Taking Profits:
1st Resistance Level: 1.095
2nd Resistance Level: 1.098
3rd Resistance Level: 1.104
❌ Stop Loss Guidelines:
Buy Trade: Set the stop loss just below the 1st Support level at 1.086.
🛎️ Trade Suggestion:
Buy EURUSD at current market price with a stop loss at 1.086, targeting the first resistance at 1.095, with further targets at 1.098 and 1.104.
The bullish signal is supported by the price action above the 20 SMA and the Ichimoku Cloud, along with a moderate RSI indication.
Keep an eye on the price action near the resistance levels as they could indicate potential pullbacks or trend reversals.

Intraday Forex Signal for GBPUSD
📊 Current Analysis
Pair: GBPUSD
Pivot Point: 1.243
Volatility: The Bollinger Bands show moderate volatility with a slight expansion.
Moving Average: The pair is trading above the 20 SMA, indicating a BULLISH trend.
Ichimoku Cloud: Price is above the cloud, confirming the bullish trend.
RSI: Approaching the 70 mark, which may suggest overbought conditions soon, but currently still bullish.
📈 Trade Direction: BULLISH
📊 Trade Probability: 72%
✨ Yesterday's Trend: The GBPUSD showed a strong bullish trend yesterday, maintaining above the moving average.
🎯 Targets for Taking Profits:
1st Resistance Level: 1.249
2nd Resistance Level: 1.253
3rd Resistance Level: 1.259
❌ Stop Loss Guidelines:
Buy Trade: Set the stop loss just below the 1st Support level at 1.240.
🛎️ Trade Suggestion:
Buy GBPUSD at current market price with a stop loss at 1.240, targeting 1.249 as the first resistance level, with further targets at 1.253 and 1.259.
The bullish outlook is supported by the technical indicators such as the 20 SMA and Ichimoku Cloud, with the RSI providing a caution for potential overbought conditions.
Monitor the RSI closely as it approaches 70 for signs of reversal.

Intraday Forex Signal for USDJPY
📊 Current Analysis
Pair: USDJPY
Pivot Point: 149.860
Volatility: The Bollinger Bands suggest increased volatility as the bands are expanding.
Moving Average: The pair has moved below the 20 SMA, indicating a BEARISH trend.
Ichimoku Cloud: Price is below the cloud, which supports the bearish sentiment.
RSI: Below 50, suggesting bearish momentum.
📈 Trade Direction: BEARISH
📊 Trade Probability: 65%
✨ Yesterday's Trend: The USDJPY trend was bearish as it moved below the moving average.
🎯 Targets for Taking Profits:
1st Support Level: 148.940
2nd Support Level: 148.290
3rd Support Level: 147.370
❌ Stop Loss Guidelines:
Sell Trade: Set the stop loss just above the 1st Resistance level at 150.510.
🛎️ Trade Suggestion:
Sell USDJPY at current market price with a stop loss at 150.510, targeting the first support at 148.940, followed by 148.290 and 147.370 as subsequent targets.
The bearish trend is confirmed by the price being below the 20 SMA and the Ichimoku Cloud, along with a bearish RSI.
Monitor for any potential reversals if the price approaches the pivot point again.

Intraday Forex Signal for USDCHF
📊 Current Analysis
Pair: USDCHF
Pivot Point: 0.887
Volatility: Bollinger Bands are moderately wide, suggesting a stable level of volatility.
Moving Average: The pair is trading below the 20 SMA, signaling a BEARISH trend.
Ichimoku Cloud: Price is below the cloud, reinforcing the bearish outlook.
RSI: Below 40, indicating bearish momentum.
📈 Trade Direction: BEARISH
📊 Trade Probability: 68%
✨ Yesterday's Trend: The trend for USDCHF was bearish, as evidenced by the movement below the moving average.
🎯 Targets for Taking Profits:
1st Support Level: 0.884
2nd Support Level: 0.882
3rd Support Level: 0.879
❌ Stop Loss Guidelines:
Sell Trade: Set the stop loss just above the 1st Resistance level at 0.888.
🛎️ Trade Suggestion:
Sell USDCHF at current market price with a stop loss at 0.888, aiming for the first target at 0.884, with further targets at 0.882 and 0.879.
The bearish trend is indicated by the position of the price relative to the 20 SMA and the Ichimoku Cloud, as well as the low RSI reading.
Monitor the trade closely for any shifts in momentum that could signal a reversal.

Intraday Forex Signal for NZDUSD
📊 Current Analysis
Pair: NZDUSD
Pivot Point: 0.5978
Volatility: Bollinger Bands are showing moderate expansion, suggesting increasing volatility.
Moving Average: The pair is trading above the 20 SMA, indicating a BULLISH trend.
Ichimoku Cloud: The price is above the cloud, confirming bullish momentum.
RSI: Around 55, which is slightly above the midpoint, indicating mild bullish momentum.
📈 Trade Direction: BULLISH
📊 Trade Probability: 70%
✨ Yesterday's Trend: The NZDUSD maintained a bullish trend throughout the previous session, staying above the moving average.
🎯 Targets for Taking Profits:
1st Resistance Level: 0.6015
2nd Resistance Level: 0.6038
3rd Resistance Level: 0.6075
❌ Stop Loss Guidelines:
Buy Trade: Set the stop loss just below the 1st Support level at 0.5955.
🛎️ Trade Suggestion:
Buy NZDUSD at current market price with a stop loss at 0.5955, targeting the first resistance level at 0.6015, with further targets at 0.6038 and 0.6075.
The bullish outlook is supported by the current price position above the 20 SMA and the Ichimoku Cloud, along with a positive RSI indication.
Keep an eye on any changes in the market that might affect this trend.

Intraday Forex Signal for AUDUSD
📊 Current Analysis
Pair: AUDUSD
Pivot Point: 0.6495
Volatility: The Bollinger Bands are moderately wide, indicating a stable level of market volatility.
Moving Average: The pair is trading above the 20 SMA, which suggests a BULLISH trend.
Ichimoku Cloud: Price is above the cloud, further confirming the upward trend.
RSI: Hovering around 60, which points to some bullish momentum, although not strongly overbought.
📈 Trade Direction: BULLISH
📊 Trade Probability: 70%
✨ Yesterday's Trend: The trend for AUDUSD was predominantly bullish, with the pair maintaining levels above the moving average.
🎯 Targets for Taking Profits:
1st Resistance Level: 0.6537
2nd Resistance Level: 0.6559
3rd Resistance Level: 0.6601
❌ Stop Loss Guidelines:
Buy Trade: Set the stop loss slightly below the 1st Support level at 0.6473.
🛎️ Trade Suggestion:
Buy AUDUSD at the current market price with a stop loss at 0.6473, targeting the first resistance level at 0.6537, followed by 0.6559 and 0.6601 as subsequent targets.
The bullish momentum is supported by the technical indicators, but keep an eye on the RSI for any signs of the market becoming overbought which could precede a pullback.
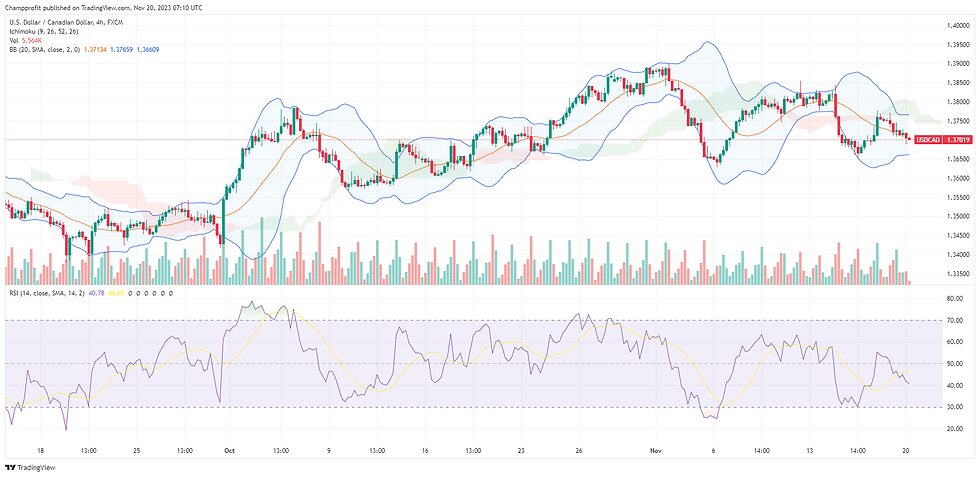
Intraday Forex Signal for USDCAD
📊 Current Analysis
Pair: USDCAD
Pivot Point: 1.3724
Volatility: The Bollinger Bands are showing moderate volatility.
Moving Average: The pair is trading below the 20 SMA, suggesting a BEARISH trend.
Ichimoku Cloud: The price is below the cloud, which typically indicates bearish momentum.
RSI: Just below 50, which leans towards a bearish sentiment but close to neutral.
📈 Trade Direction: BEARISH
📊 Trade Probability: 63%
✨ Yesterday's Trend: The USDCAD was bearish as it moved below the moving average.
🎯 Targets for Taking Profits:
1st Support Level: 1.3676
2nd Support Level: 1.3629
3rd Support Level: 1.3581
❌ Stop Loss Guidelines:
Sell Trade: Set the stop loss just above the 1st Resistance level at 1.3771.
🛎️ Trade Suggestion:
Sell USDCAD at the current market price with a stop loss at 1.3771, targeting the first support level at 1.3676, followed by 1.3629 and 1.3581 as subsequent targets.
The bearish outlook is supported by the price being below the 20 SMA and the Ichimoku Cloud, with the RSI indicating a slight bearish momentum.
Keep an eye on the RSI as it hovers around the midpoint for any potential shifts in momentum.

Intraday Forex Signal for EURGBP
📊 Current Analysis
Pair: EURGBP
Pivot Point: 0.875
Volatility: The Bollinger Bands are showing moderate volatility, with no significant expansion or contraction.
Moving Average: The pair is trading just above the 20 SMA, suggesting a slight BULLISH bias.
Ichimoku Cloud: The price is above the cloud, supporting the bullish trend.
RSI: Just above 50, indicating a neutral to slightly bullish momentum.
📈 Trade Direction: BULLISH
📊 Trade Probability: 64%
✨ Yesterday's Trend: The EURGBP showed a mild bullish trend, staying above the moving average for the majority of the session.
🎯 Targets for Taking Profits:
1st Resistance Level: 0.877
2nd Resistance Level: 0.878
3rd Resistance Level: 0.880
❌ Stop Loss Guidelines:
Buy Trade: Set the stop loss just below the 1st Support level at 0.874.
🛎️ Trade Suggestion:
Buy EURGBP at current market price with a stop loss at 0.874, targeting the first resistance level at 0.877, followed by 0.878 and 0.880 as subsequent targets.
The bullish trend is mildly supported by technical indicators, but caution is advised due to the close proximity of the RSI to the midpoint, which could indicate potential for reversal or lack of strong momentum.
Disclaimer: These trading signals is based on the current chart and market conditions. Always conduct your own analysis and consider risk management strategies before entering any trade. Markets are dynamic, and conditions can change rapidly.

As with all investments, your capital is at risk. Investments can fall and rise and you may get back less than you invested.
The information provided does not constitute, in any way, a solicitation or inducement to buy or sell securities and similar products.
Forex signals ,comments and analysis reflect the views of CHAMP PROFIT at any given time and are subject to change at any time. ©2023 by Champ Profit.