Technical Analysis: Intraday Forex Signals, October 26, 2023
- forex368

- Oct 26, 2023
- 6 min read
Headlines That Matter Today:
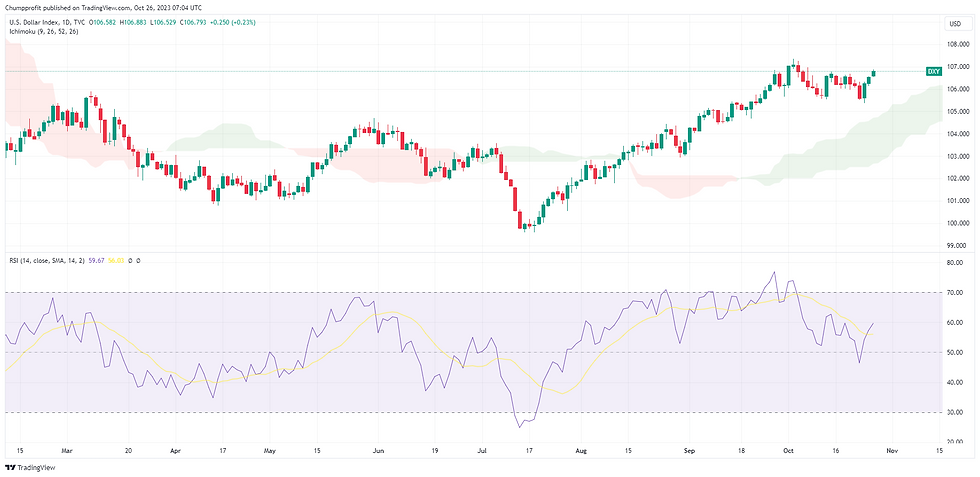
The U.S. Dollar is ascending, hitting near one-year highs due to robust Treasury yields and strong economic data.
Conversely, EUR/USD faces uncertainty, with all eyes on the upcoming ECB rate decision and U.S. Q3 GDP figures.
The Australian Dollar is unstable as the RBA downplays inflation, marking November 7 as a key date for its next meeting.
In commodities, gold holds strong at over $1,980 an ounce amid Middle East tensions, while oil prices fluctuate around $85 a barrel due to geopolitical unrest.
Overall, the market presents both opportunities and volatility, requiring focused strategies and risk management.


Intraday forex signals presented here are derived using the previous close's pivot point, complemented by RSI and Ichimoku Cloud indicators to define the trading signal range.
Forex Signals

Daily Forex Signal for XAUUSD - 26 October 2023
🟢 Breakdown:
Direction: BEARISH
Pivot Point: 1973.45
📊 Indicators:
Ichimoku: The current price is below the cloud, signaling a bearish trend.
RSI: The RSI is below 50, indicating selling pressure.
🎯 Profit Targets:
1st Support: 1970.24
2nd Support: 1968.19
3rd Support: 1964.98
❌ Stop Loss:
1st Resistance: 1975.50
2nd Resistance: 1978.71
3rd Resistance: 1980.76
📊 Suggestion: Given the bearish direction, traders might consider shorting XAUUSD when it bounces off the resistance levels, setting stop losses at the nearest resistance, and aiming for subsequent support levels as profit targets.

Daily Forex Signal for WTI Crude Oil - 26 October 2023
🟢 Breakdown:
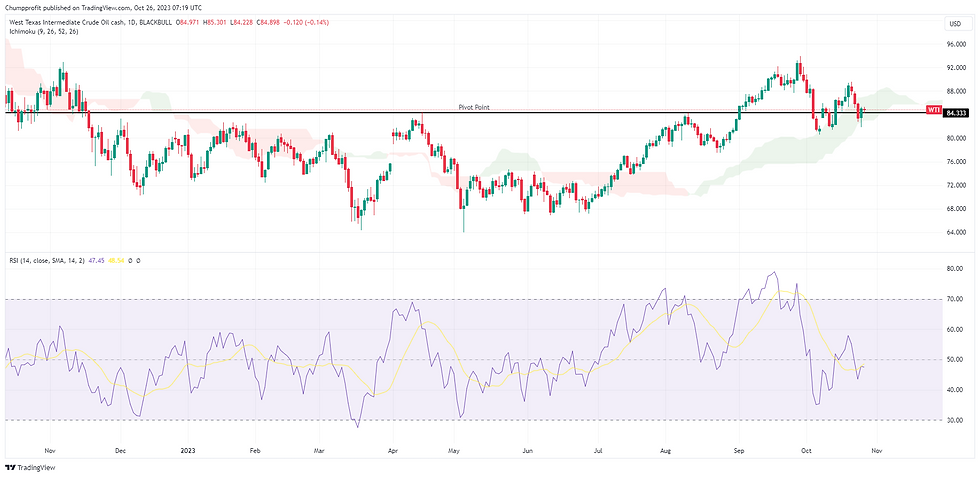
Direction: Based on the chart, WTI seems to be in a neutral to bearish zone.
Pivot Point: Approx. 84.33 USD (as indicated by the current price level on the chart)
📊 Indicators:
Ichimoku: The current price appears to be hovering around the Ichimoku cloud, suggesting a period of uncertainty or consolidation. A break below the cloud could indicate a stronger bearish trend.
RSI: The RSI is slightly below 50, hinting at mild selling pressure or a consolidation phase.
🎯 Profit Targets: On a Sell/Short
1st Support: Based on visual inspection, approx. 80.00 USD
2nd Support: Approx. 76.00 USD
3rd Support: Approx. 72.00 USD
❌ Stop Loss:
1st Resistance: Approx. 88.00 USD (short-term peaks in the recent past)
2nd Resistance: Approx. 92.00 USD
3rd Resistance: Approx. 96.00 USD (recent high)
📊 Suggestion: Given the hovering around the Ichimoku cloud and a slightly bearish RSI, traders might consider waiting for clearer signals before entering a position.
If deciding to short, consider placing stop-loss orders near the first resistance and targeting subsequent support levels for profit.
Conversely, for a bullish stance, wait for the price to break above the cloud with substantial volume and RSI support.

🟢 Daily Forex Signals for EUR/USD:
📊 Breakdown:
Direction: Bearish for EUR/USD.
Pivot Point: The chart indicates a pivot point around the level of 1.0550.
📊 Indicators:
Ichimoku: The price is currently below the cloud, suggesting a bearish sentiment.
RSI: The RSI is below 50, indicating bearish momentum.
🎯 Profit Targets:
1st Support (Target): 1.052
2nd Support (Target): 1.050
3rd Support (Target): 1.048
❌ Stop Loss:
1st Resistance (Stop Loss): 1.058
2nd Resistance (Stop Loss): 1.060
3rd Resistance (Stop Loss): 1.063
📊 Suggestion:
Considering the bearish indicators and price action, traders may look into entering short positions on EUR/USD. Monitoring the resistances mentioned above is crucial to anticipate potential reversals.

Daily Forex Signals for GBP/USD:
🟢 Breakdown:
Direction: Sell (Bearish)
Pivot Point: 1.213
📊 Indicators:
Ichimoku: The GBP/USD is currently trading below the cloud, indicating a bearish trend.
RSI: The RSI is below the 50 mark, suggesting bearish momentum.
🎯 Profit Targets:
1st Target: 1.209
2nd Target: 1.206
3rd Target: 1.201
❌ Stop Loss:
1st Resistance: 1.216
2nd Resistance: 1.220
3rd Resistance: 1.223
📊 Suggestion: Given the bearish indicators, traders might consider selling the GBP/USD pair, setting their take-profit levels at the mentioned targets and stop-loss at the provided resistances.

Daily Forex Signals for USD/JPY:
🟢 Breakdown:
Direction: Buy (Bullish)
Pivot Point: 150.113
📊 Indicators:
Ichimoku: The USD/JPY is trading above the cloud, signifying a bullish trend.
RSI: The RSI is above 50, suggesting bullish momentum is building.
🎯 Profit Targets:
1st Target: 150.437
2nd Target: 150.643
3rd Target: 150.967
❌ Stop Loss:
1st Support: 149.907
2nd Support: 149.583
3rd Support: 149.377
📊 Suggestion: Considering the bullish indicators, traders might consider buying the USD/JPY pair, setting their take-profit levels at the provided targets and placing stop-loss orders at the specified support levels.

Daily Forex Signals: USD/CHF
🟢 Breakdown:
Direction: BULLISH
Pivot Point: 0.899
📊 Indicators:
Ichimoku: Price is currently above the cloud, indicating a potential bullish trend continuation.
RSI: With a value of around 54.5, it indicates a neutral momentum with a slight bullish bias.
🎯 Profit Targets:
1st Resistance: 0.904
2nd Resistance: 0.909 (Estimated based on trend)
3rd Resistance: 0.914 (Estimated based on trend)
❌ Stop Loss:
1st Support: 0.894
2nd Support: 0.890
3rd Support: 0.885 (Estimated based on trend)
📊 Suggestion: Consider entering a long position if the price sustains above the pivot point with a tight stop loss below the first support. Monitor key indicators and adjust strategy accordingly.

Daily Forex Signals for NZD/USD:
🟢 Breakdown:
Direction: SELL (Bearish)
📊 Pivot Point:
0.5825
📊 Indicators:
Ichimoku: The price is below the cloud, suggesting a bearish sentiment.
RSI: Currently at 38.48, indicating neither an overbought nor oversold condition but leaning towards potential further bearish movement.
🎯 Profit Targets:
1st Support: 0.5778
2nd Support: 0.5753
3rd Support: 0.5706
❌ Stop Loss:
1st Resistance: 0.5850
2nd Resistance: 0.5897
3rd Resistance: 0.5922
📊 Suggestion: Considering the bearish sentiment indicated by the Ichimoku and the current position of the RSI, traders might consider shorting NZD/USD at the current level or near the pivot point, setting profit targets at the mentioned supports and stop losses at the mentioned resistances.
Always ensure to manage risk appropriately.

🟢 AUDUSD Breakdown:
Direction: Bearish
Pivot Point: 0.6337
📊 Indicators:
Ichimoku: The price is below the cloud, suggesting a bearish sentiment.
RSI: The RSI is below 50, further indicating a bearish momentum.
🎯 Profit Targets:
1st Support: 0.6303 2nd Support: 0.6266 3rd Support: 0.6232
❌ Stop Loss:
1st Resistance: 0.6365 2nd Resistance: 0.6399 3rd Resistance: 0.6462
📊 Suggestion: Given the bearish indicators and the current price position below the Ichimoku cloud, traders might consider entering a short position with caution, closely monitoring the specified support and resistance levels for potential exit points and stop loss levels.

Daily Forex Signal for USD/CAD
🟢 Breakdown:
Direction: BULLISH
Pivot Point: 1.3781
📊 Indicators:
Ichimoku: The price is currently above the cloud, suggesting a bullish sentiment.
RSI: The RSI is above 60, indicating an upward momentum.
🎯 Profit Targets:
1st Resistance: 1.3830
2nd Resistance: 1.3863
3rd Resistance: 1.3912
❌ Stop Loss:
1st Support: 1.3748
2nd Support: 1.3699
3rd Support: 1.3666
📊 Suggestion: Given the bullish indicators, consider entering a long position near the pivot point, aiming for the resistance levels as profit targets, and setting your stop loss at the support levels to protect against potential reversals.

EUR/GBP Forex Signal - October 26, 2023
🟢 Breakdown:
Direction: BULLISH
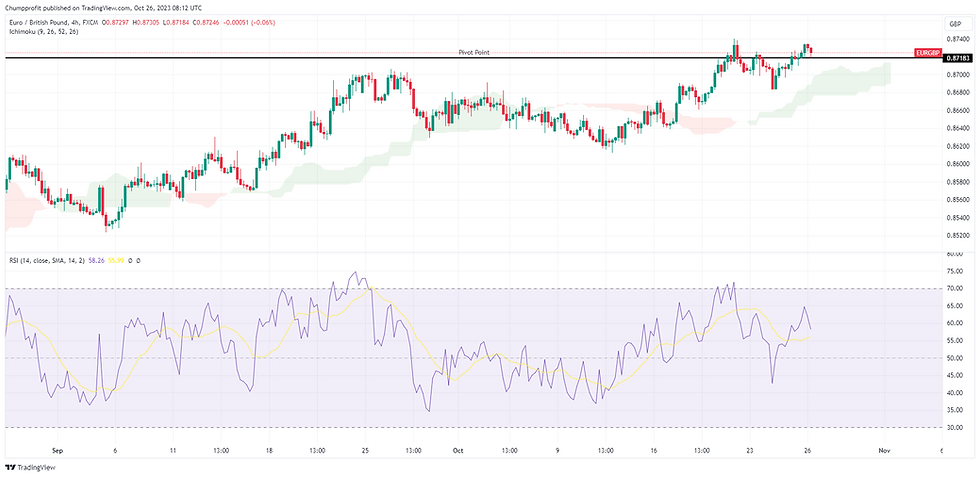
Pivot Point: 0.8718
📊 Indicators: Ichimoku: The EUR/GBP pair is trading slightly above the Ichimoku cloud, which typically suggests a bullish outlook. The cloud acts as a dynamic support and resistance level.
RSI: The Relative Strength Index (RSI) is hovering near the midline, indicating a neutral momentum, but with a slight lean towards the bullish territory.
🎯 Profit Targets:
1st Resistance: 0.8734 2nd Resistance: 0.8744 3rd Resistance: 0.8760
❌ Stop Loss: 1st Support: 0.8708 2nd Support: 0.8692 3rd Support: 0.8682
📊 Suggestion: Given the current setup, traders might consider entering a long position near the pivot point with a target towards the first and second resistance levels. However, as always, it's essential to set a stop loss to protect against any potential downturns.
Disclaimer: Trading forex involves a significant risk of loss. Ensure you fully understand the risks involved and seek independent advice if necessary.
As with all investments, your capital is at risk. Investments can fall and rise and you may get back less than you invested.
The information provided does not constitute, in any way, a solicitation or inducement to buy or sell securities and similar products.
Comments and analysis reflect the views of CHAMP PROFIT at any given time and are subject to change at any time. ©2023 by Chump Profit.


