Technical Analysis: Your Daily Dose of Market Insights, June 22, 2023
- forex368

- Jun 22, 2023
- 1 min read
Headlines.
- Federal Reserve Chair Jerome Powell maintains a hawkish tone, prompting investors to assess future rate policy from the Fed.
- Australia's S&P/ASX 200 index loses 1.17%, while Japan's Nikkei eases 0.25%; Chinese and Hong Kong stock markets are closed for a holiday.
- Attention shifts to the Bank of England (BoE) as a rate hike is widely expected, with economists divided on the magnitude of the raise after unexpected inflation data.
- Crude oil prices dip slightly but remain above $72 per barrel.
- Bitcoin maintains gains after surpassing $30,000 for the first time since April, driven by speculation surrounding BlackRock Inc.'s filing for a US spot Bitcoin exchange-traded fund.
Key events this today:
Eurozone consumer confidence
Rate decisions in UK, Switzerland, Indonesia, Norway, Mexico, Philippines, Turkey,
US Conference Board leading index, initial jobless claims, current account, existing home sales
Fed’s Powell delivers testimony before the Senate Banking Committee
Cleveland Fed’s Loretta Mester speaks
Dollar Index (DXY) Intraday:
Pivot Level: 102.26

Gold Intraday:
Pivot Level: 1931.15

USD/JPY Intraday:
Pivot: 141.86

AUD/USD Intraday:
Pivot: 0.6781

Crude Oil (WTI) Intraday:
Pivot: 72.11

USD/CAD Intraday:
Pivot: 1.3190

EUR/USD Intraday:
Pivot: 1.096

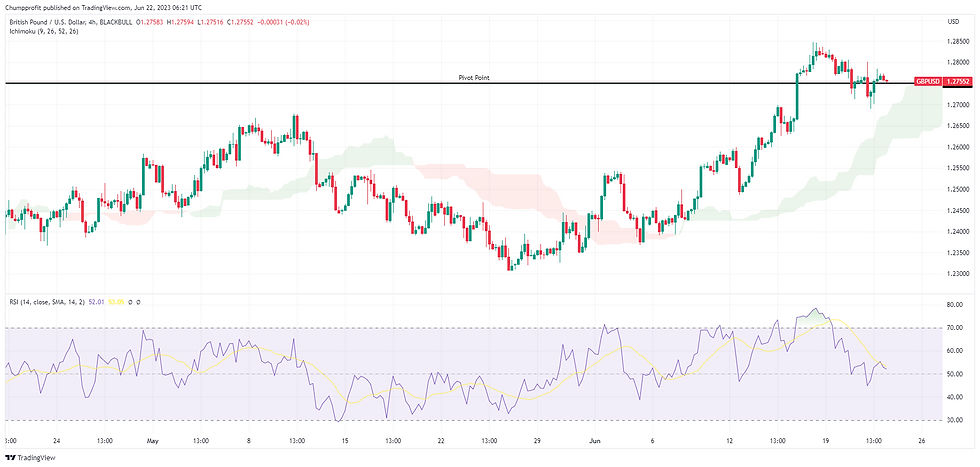
GBP/USD Intraday:
Pivot: 1.275

EUR/GBP Intraday:
Pivot: 0.8582

Nasdaq 100 Intraday:
Pivot:
14,910.00

Our website offers information about investing, trading and saving, but not personal advice. If you're not sure which investments are right for you, please request advice, for example from your financial advisers. If you decide to invest or trade, remember that investments can go up and down in value, so you could get back less than you put in. ©2023 by Chump Profit.


