Technical Analysis:Your Daily Dose of Market Insights, June 13, 2023
- forex368

- Jun 13, 2023
- 1 min read
Morning Finance Brief:
- Global markets show mixed movements as investors assess central bank policies and economic indicators.
- Surprise rate hikes by the Reserve Bank of Australia and Bank of Canada have heightened concerns about prolonged tightening cycles.
- European Central Bank expected to raise rates by 25 bps, while the Bank of Japan likely to maintain an ultra-loose policy.
- US Treasury yields show a slight decrease, while the US dollar index edges higher against major currencies.
- Asian equities and US/European futures rise on optimism about a potential pause in the Federal Reserve's tightening campaign.
- Key events this week include the FOMC rate decision, US CPI data, and Eurozone industrial production figures.
CHUMP PROFIT Technica Outlook and Review
Dollar Index (DXY) Intraday: Bearish
Pivot Level: 103.54

Gold Intraday:
Pivot Level: 1963.40

USD/JPY Intraday:
Pivot: 139.48

AUD/USD Intraday:
Pivot: 0.6751

Crude Oil (WTI) Intraday:
Pivot: 67.42

USD/CAD Intraday:
Pivot: 1.3357

EUR/USD Intraday:
Pivot: 1.076

GBP/USD Intraday:
Pivot: 1.257

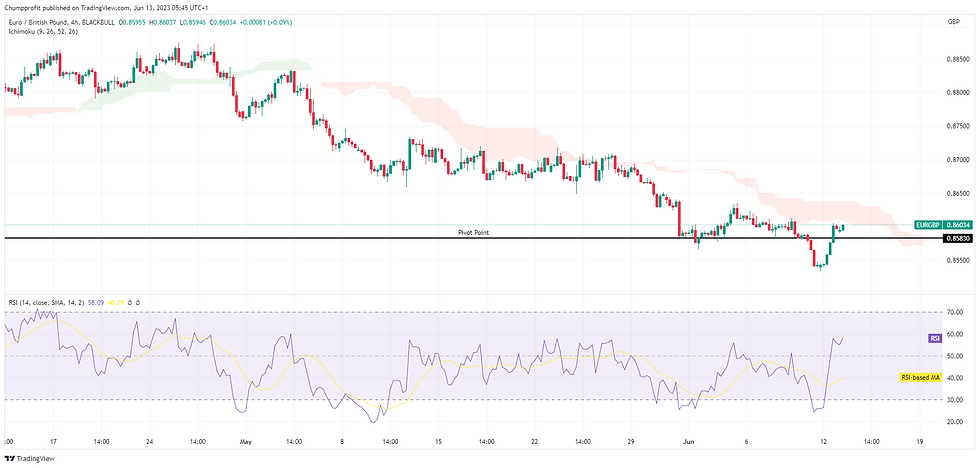
EUR/GBP Intraday:
Pivot: 0.8583
Nasdaq 100 Intraday:
Pivot:
14715.00

Our website offers information about investing, trading and saving, but not personal advice. If you're not sure which investments are right for you, please request advice, for example from your financial advisers. If you decide to invest or trade, remember that investments can go up and down in value, so you could get back less than you put in. ©2023 by Chump Profit.