Technical Analysis:Your Daily Dose of Market Insights, June 9, 2023
- forex368

- Jun 9, 2023
- 1 min read
Brief Highlights:
- S&P 500 advances 20%, signalling new bull market potential
- Asian equities follow S&P 500's lead, boosted by Chinese stimulus hopes
- Increase in US jobless claims cools labour market, benefits tech sector
- Yen weakens, Turkish lira weakens after new central bank governor appointment
- Oil prices fall on demand concerns, US-Iran nuclear deal scepticism
- Market uncertain about US-Iran deal, impacting oil price expectations
- Key event: China's PPI, CPI on Friday.
Dollar Index (DXY) Intraday:
Pivot Level: 103.57

Gold Intraday:
Pivot Level: 1958.55

USD/JPY Intraday:
Pivot: 139.32

AUD/USD Intraday:
Pivot: 0.6695

Crude Oil (WTI) Intraday:
Pivot: 71.11

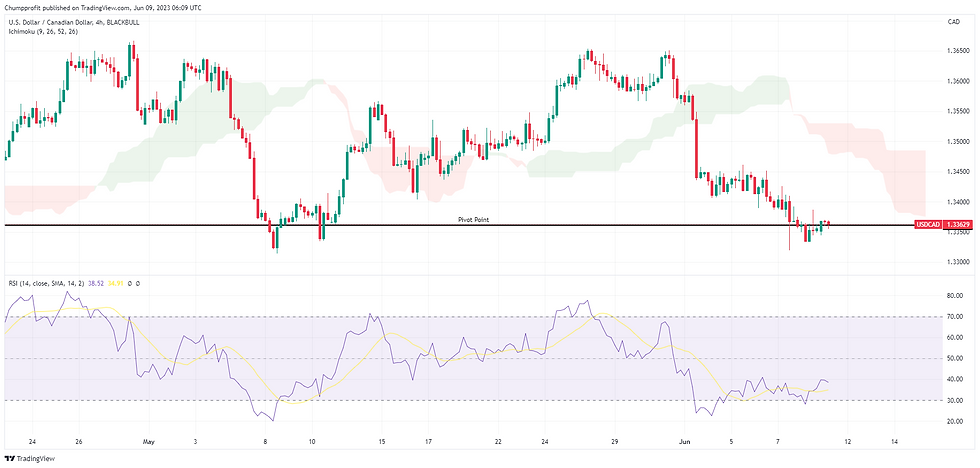
USD/CAD Intraday:
Pivot: 1.3361
EUR/USD Intraday:
Pivot: 1.076

GBP/USD Intraday:
Pivot: 1.252

EUR/GBP Intraday:
Pivot: 0.8595

Nasdaq 100 Intraday:
Pivot:
14434.00

Our website offers information about investing, trading and saving, but not personal advice. If you're not sure which investments are right for you, please request advice, for example from your financial advisers. If you decide to invest or trade, remember that investments can go up and down in value, so you could get back less than you put in. ©2023 by Chump Profit.